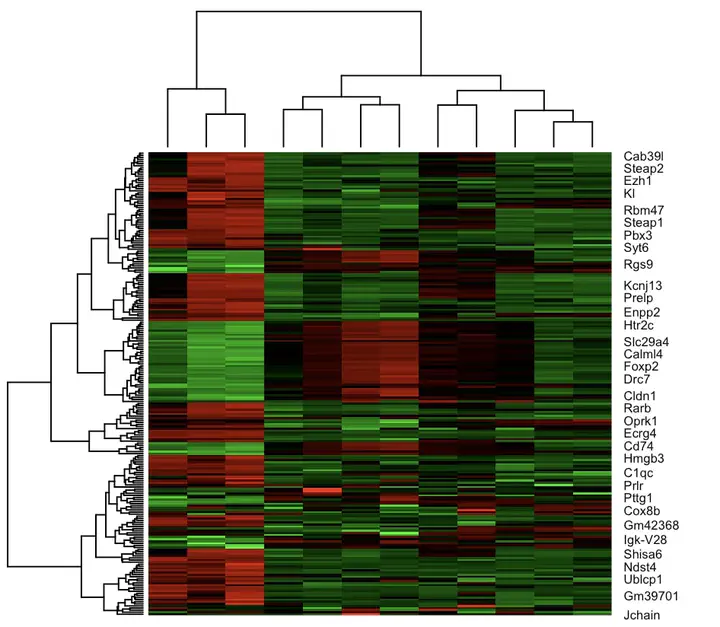
 Heatmap of differentially expressed genes
Introduction: Unveiling the Molecular Landscape through Microarray Expression Profiling
In the realm of modern genetic analysis, microarray expression profiling stands as a cornerstone technique, offering a comprehensive glimpse into the complex molecular dynamics that govern development and physiological processes. The methodology involves a matrix of gene-specific probes immobilized on a microarray, facilitating the concurrent assessment of gene expression levels. Upon hybridization with labeled RNA or cDNA derived from experimental samples, microarrays provide a quantitative readout of gene expression, thus unraveling intricate molecular insights.
Our current investigation is based on a pilot dataset, a precursor to an extensive experimental endeavor, characterized by two distinct time points: T-18 and T-24. Four distinct strains—LPR, LPR2, PLUS, and WildType (WT)—have been employed, each contributing a unique facet to our genetic inquiry. At the crux of our analysis lies a pivotal question: How does the MRL/MPJ domain contrast with the WT across these temporal stages? Worth noting is the fact that the MRL/MPJ strain, encompassing LPR, LPR2, and PLUS, serves as a representative model for Lupus disease, thereby introducing a complex genetic dimension to our study.
Step 1: Ensuring Data Fidelity through Quality Control
Before proceeding with comprehensive analysis, meticulous quality control measures are imperative to guarantee data integrity. This involves a systematic evaluation of the dataset for technical artifacts, outliers, or irregularities that could skew subsequent analyses. By adhering to stringent quality control protocols, we establish a robust foundation upon which our subsequent analyses rest.
Step 2: Data Normalization for Comparative Analysis
Normalization of gene expression data is a fundamental prelude to comparative analysis. The objective is to mitigate technical variability and enable meaningful inter-sample comparisons. The process involves the logarithmic transformation of raw intensity values, followed by the calculation of median log-intensity values for each probe across all arrays. This median value is subsequently used to correct log-intensity values, effectively reducing systematic biases.
Subsequently, quantile normalization is executed to align the distribution of log-intensity values across arrays. This ensures that data is on a consistent scale, permitting accurate cross-sample analysis. Finally, inverse-log transformation restores the data to its original scale, yielding a normalized dataset amenable to rigorous analysis.
Step 3: Unmasking Differential Expression and Patterns
The normalized dataset serves as a canvas for robust statistical analyses. Differential gene expression analysis identifies genes with significant expression changes between experimental conditions. Statistical significance is determined using methods such as t-tests or linear models, and multiple testing corrections are applied to control for false positives.
Clustering algorithms are employed to discern expression patterns, grouping genes with similar expression profiles. This facilitates the identification of co-regulated genes, shedding light on potential functional relationships and pathways.
Step 4: Interpretation and Biological Context
The culmination of our analysis demands an intricate weaving of statistical insights with biological context. Interpretation of differentially expressed genes and expression patterns necessitates a comprehensive exploration of relevant literature and existing biological knowledge. This integration enables us to decipher the implications of our findings within the broader biological framework.
In Conclusion: Unraveling Genetic Complexity
Microarray expression profiling emerges as a formidable tool in our endeavor to unravel genetic intricacies. Through meticulous quality control, normalization, and statistical analyses, we decipher expression dynamics, shedding light on the genetic nuances underlying developmental processes and disease models. As we unravel the genetic signatures of the MRL/MPJ domain in contrast to the WT, we inch closer to unraveling the enigmatic molecular landscape, paving the way for deeper insights into Lupus disease and the broader realm of genetic regulation.
References
These resources have been used as inspiration to create a suitable pipeline for the microarray enrichment analysis.
Analyze your own microarray data in R/Bioconductor - https://wiki.bits.vib.be/index.php/Analyze_your_own_microarray_data_in_R/Bioconductor
Bioconductor - Gene ontology based enrichment analysis - https://bioconductor.org/packages/release/workflows/vignettes/maEndToEnd/inst/doc/MA-Workflow.html#13_Gene_ontology_(GO)_based_enrichment_analysis
Bioconductor - topGO - https://bioconductor.org/packages/release/bioc/vignettes/topGO/inst/doc/topGO.pdf
Bioconductor - ReactomePA - https://bioconductor.org/packages/release/bioc/manuals/ReactomePA/man/ReactomePA.pdf